Indoor Air Quality Health Monitoring
Key to Safety for Re-Opening Our Schools
Give your students, families, faculty and staff reassurance that the air inside your building is healthy and safe
Ace Energy Services, Inc. will monitor the key indicators of indoor air quality and provide a weekly report that includes data interpretation. Follow-up monitoring can be conducted to verify results from measures that are taken, such as enhanced ventilation or improved air filtration.
Weekly reports show relative air quality for each of these parameters

Monitoring temperature and humidity along with the direct measurement of pollutants helps give a more complete understanding of the dynamics that may be effecting air quality.
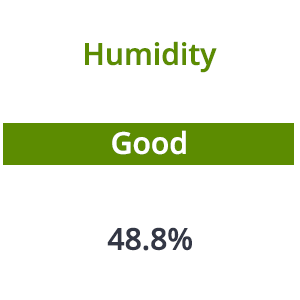
Maintaining humidity in a range of 40-60% supports human health in terms of better resistance to virus transmission.
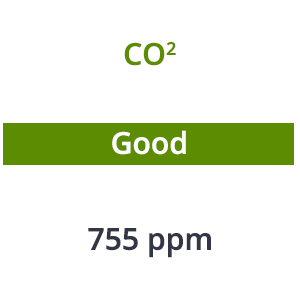
Elevated levels of carbon dioxide indicate an insufficient amount of fresh air, which can indicate unhealthy conditions that could affect transmission of COVID and other airborne viruses.
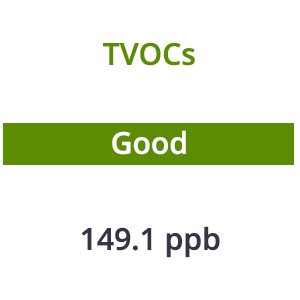
Total volatile organic compounds are emitted by many common building materials, furniture, paint & cleaning products, and are a main source for poor to hazardous indoor air quality.
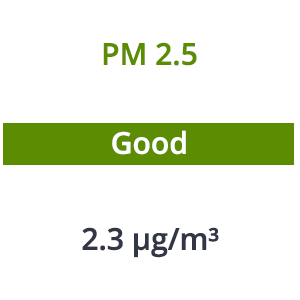
Exposure to inhalable fine particulate matter in indoor air poses potential to serious health problems. Sources may originate from migrating outside pollutants, or from cooking, heating sources, smoking within the premises.
Weekly reports include 24-hour graphs with highlights indicating areas of concern
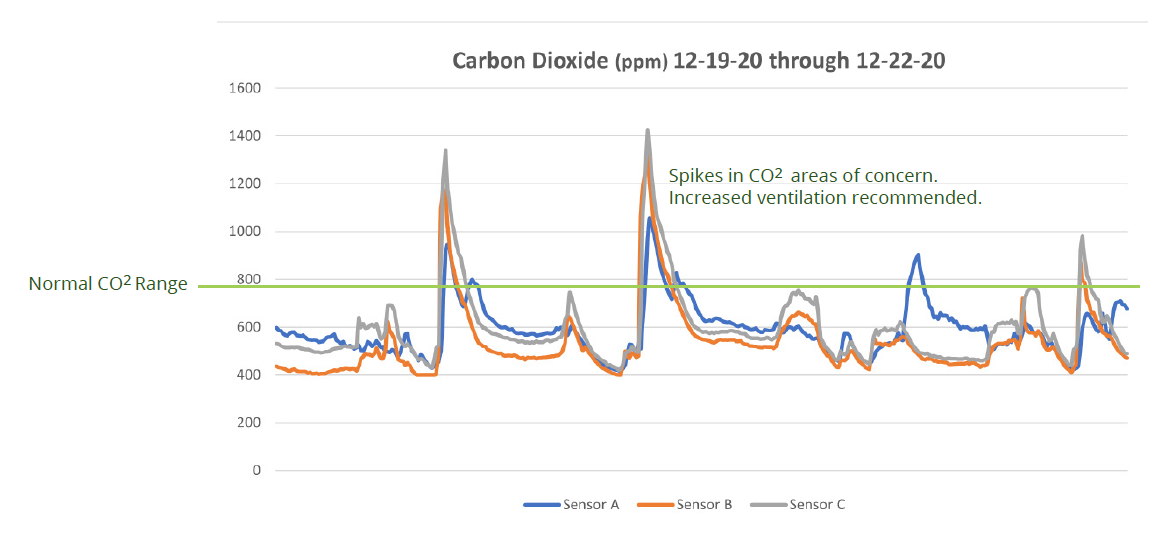
Example CO2 levels report indicates acceptable range from 3 separate sensor locations over a four-day period. Increases in parts-per-million above 800 ppm indicate areas of concern.
CONTACT US
Want to know more about monitoring the quality of air at your school? Call us at 617-221-6281 or fill out this form to get in touch.
